CHAPEL HILL – With Wall Street heading into earnings season and stock valuations well above long-term norms, investors are questioning whether the so-called “everything bubble” is overdue for a pop. For this week’s Kenan Insight, Research Services Director Ashley Brown sat down with Executive Director Greg Brown and Research Director Christian Lundblad to talk asset price bubbles and what may be next.
Ashley: Increasingly, we’re hearing talk about how all assets are overvalued. What is your view on whether we are experiencing a wave of price bubbles across different asset classes? Let’s start with stock market prices.
Christian: Simply put, the equity market is rather expensive. One of my favorite valuation ratios is Robert Shiller’s Cyclically-Adjusted Price-to-Earnings (CAPE) Ratio; for a portfolio of large capitalization stocks, this gauges stock market prices relative to a moving average of firms’ corporate earnings. Apart from the dotcom bubble of the late 1990s, the U.S. equity market is the most expensive it has been since 1880 when measured in this way (see Figure 1). This exception should not provide much comfort as the dotcom peak was followed by a severe decline in stocks prices of over 50%. Further, the current CAPE peak even exceeds the relative prices observed during roaring 1920s; that, too, did not end well.
Figure 1: Shiller Cyclically-Adjusted Price-to-Equity Ratio
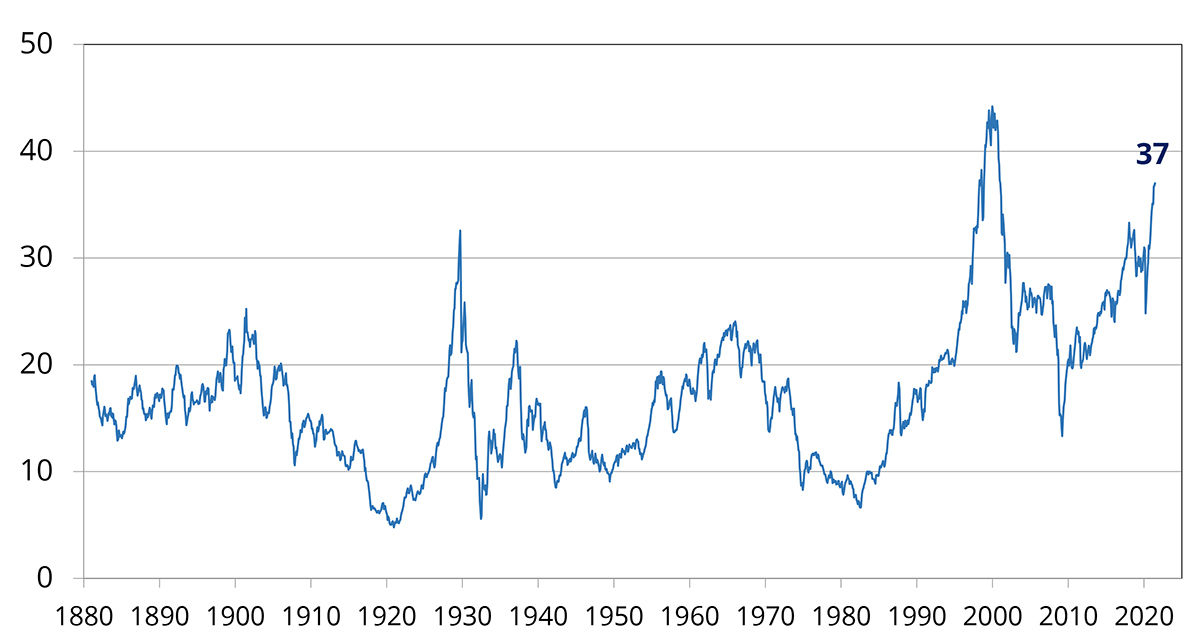
Markets are pricing in a significant amount of real growth in corporate earnings that I think is simply a fantasy. Hence, these prices really look like another bubble to me. However, if you look closely, you will see that this steep increase in the CAPE ratio originates in the global financial crisis. It is no coincidence that this explosion (only very temporally displaced by the COVID crisis in spring 2020) was accompanied by unprecedented amounts of monetary, and to some degree fiscal, policy in response to the two challenging crises of the last 12+ years. While acknowledging the important role the Federal Reserve has played to help steward the economy through these episodes, I contend that policy excess is nevertheless a major driving force. The reluctance of the Fed to walk back their various stimulus efforts has engendered asset price inflation (even if it has, until recently, been mostly absent from consumer goods price inflation).
Where is economy going? Who knows? Known and unknowns cloud the forecast
Greg: A counterargument can be made using a simple model of stock prices (e.g., the Gordon Growth Model) which says price levels depend on earnings growth rates and the discount rate applied to future earnings. First, corporate profits have actually been growing rapidly and the economy is expected to have one of its best years on record in 2021.
Consumer demand is spiking and allowing businesses to push through price hikes further helping profits. It also looks increasingly unlikely that the Biden administration will be able to enact proposed increases in the corporate tax rate. All these point to very strong profit growth. Second, discount rates are near an all-time low. If we use low-investment-grade bond yields as a rough proxy for trends in the equity discount rate (see Figure 2), these yields have only been as low as they are now one other time in the last 100 years. In fact, this prior period just after WWII was followed by a sustained run in stocks that lasted over 20 years even as discount rates rose to more typical levels.
Figure 2: Moody’s Seasoned Baa Corporate Bond Yield
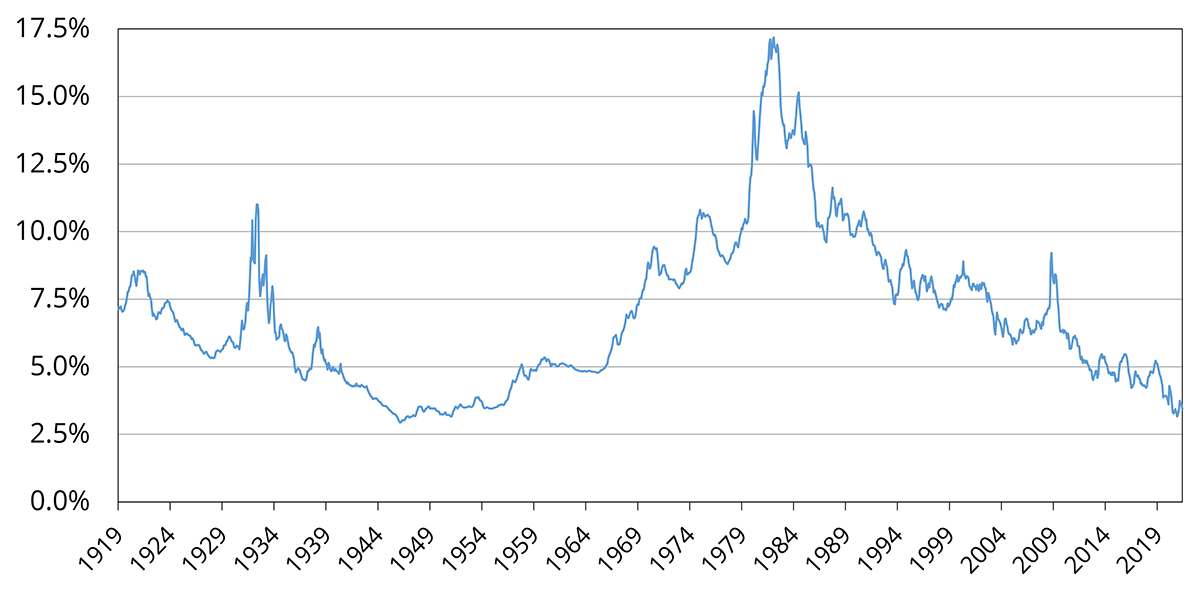
Source: Federal Reserve Board of Governors.
Ashley: So, let’s dig into that assumption about low discount rates justifying high stock prices. Is the bond market overpriced?
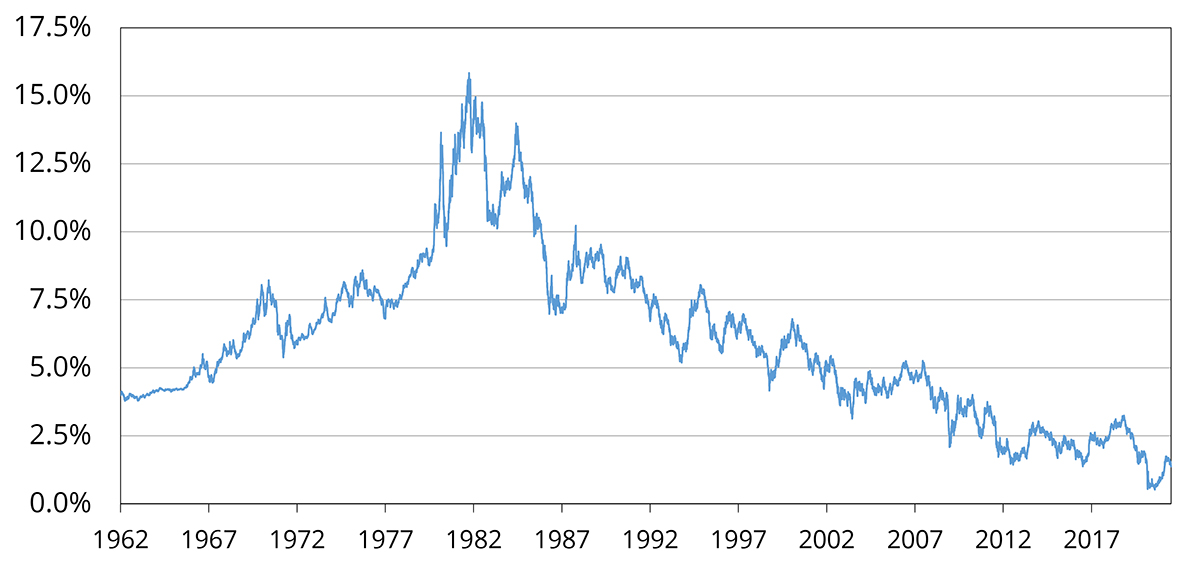
Christian: It is correct to acknowledge that the yield on the 10-year U.S. Treasury note remains below 1.5%. Prior to the pandemic, it had never been this low (see Figure 3). However, recall that bond yields are nothing more than the inverse of bond prices – so this statement is equivalent to saying that bond prices, like stock prices, are also at historic highs. Given the Fed is currently purchasing $120 billion per month in bonds (including a healthy dose of U.S. Treasuries), one can immediately see the price support. Again, for historical context, this has been building since the global financial crisis, where we have witnessed trillions of collective U.S. dollars of Fed bond purchases along with a resulting set of abnormally low bond yields. Currently, inflation-adjusted Treasury yields are actually negative for all maturities. These prices are not sustainable once the Fed tapers its bond buying.
Figure 3: 10-Year U.S. Treasury Yields
Greg: It may not be that clean cut. It is true that when the Fed slowed buying after the GFC in 2013, yields bumped up, but rates settled into a range just about 1% above the trough even as the economy was picking up speed. The reality is that there are not many safe places for people to invest, and most of the alternatives have even lower yields (e.g., European and Japanese sovereign bonds). Further, there is almost always strong demand for high quality U.S. dollar assets in periods of uncertainty, and I expect the current uncertain times to persist for the foreseeable future.
Ashley: Another market that has been getting a lot of attention lately is residential real estate. By most measures, prices are in the midst of a historic climb. What can we expect to see ahead for this market?
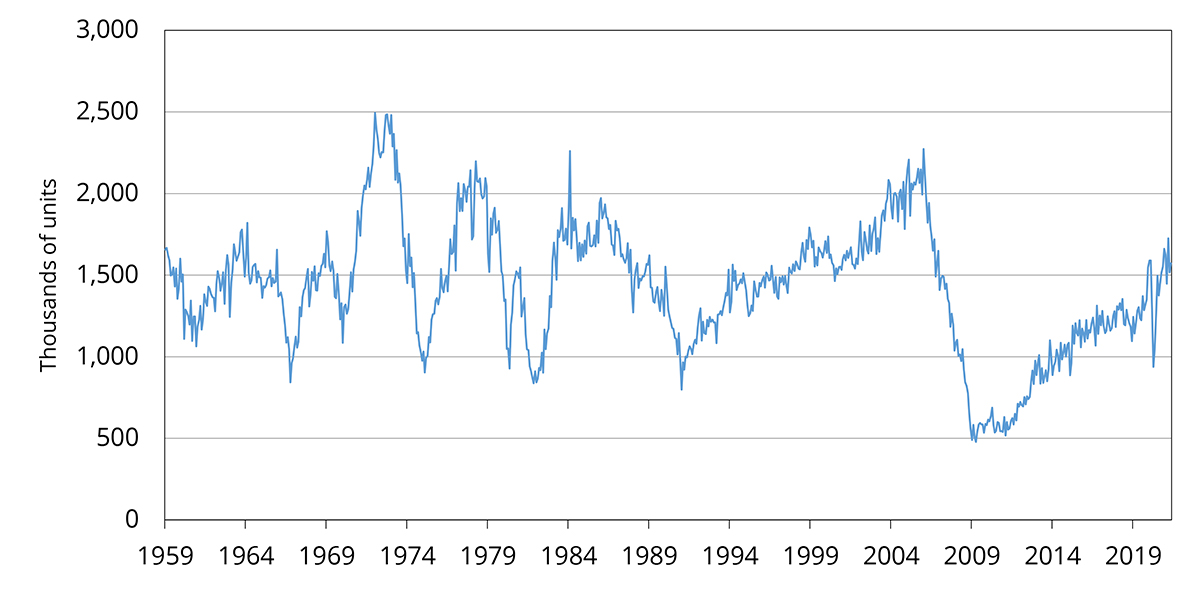
Christian: Home prices are increasing at a stunning rate, yes – just check the Zillow estimate on your house and you will be surprised. However, of all the markets we might discuss, residential real estate may be the one place where I don’t see as clear cut a case for a bubble. Mortgage rates are low, and borrowers are truly qualified in almost all cases — unlike the 2000s. Homebuyers can lock in low rates for 30 years, and so even if the bond market is a bubble, it doesn’t matter to them (unless they must move or experience a loss of income). Perhaps most significantly, there is a serious housing shortage overall, especially among larger homes which have been in high demand. This shortage could take a decade to resolve given that new construction is harder and more expensive than ever. Despite the massive surge in housing demand, as a testament to this imbalance, housing starts remain near their long-run average after being below average for almost all of the last 15 years (see Figure 4).
Figure 4: Newly Privately Owned Housing Units
Greg: But, surely the surge in prices this year will be short-lived given the reshuffling of the labor force and limited supply — homeowners are reluctant to list given how quickly prices are ratcheting up because they don’t want to underprice their house and then get locked out. This can’t go on much longer, and prices will start to drop back to more reasonable levels. It may not be the bubble we had 15 years ago, but it is a probably a short-term bubble nonetheless.
Ashley: So you have already mentioned the potential role of the Fed; what are your opinions on the tightrope they are walking?
Christian: The Fed is behind the curve. While there remain more than 9 million Americans without jobs, we nevertheless have record job openings, a record amount of fiscal stimulus and a wall of cash on household and corporate balance sheets ready to go. Most important, we are starting to see the emergence of meaningfully higher inflation (over 5% year-on-year in the June CPI print). While some of the inflation components are certainly transitory, figures like this create a danger of unseating expectations of moderate future inflation. Once expectations of future inflation accelerate, we run the risk of a price spiral where wages and other contractual prices ratchet up. Inflation risk, which the Fed has downplayed in its recent language, point toward a Fed that has painted itself into a corner by promising last year that it would provide exceptionally easy monetary conditions for years to come. Surely, the Fed must regret this now.
Greg: The Fed is fine. People worried about this same scenario after the global financial crisis and there was a much-hyped “taper tantrum”
– but in hindsight, that was barely a blip and the economy didn’t react. More important now are the 9 million unemployed Americans Christian mentioned. There are short-term frictions in the labor market as the economy sorts out how it will operate in a post-pandemic world, and many of these people run the risk of long-term unemployment if the economy slows. So, it makes perfect sense for the Fed to remain very accommodative. By most accounts, the recent inflation is transitory. For example, the market for Treasury Inflation Protected Securities (TIPS) provides a good read on intermediate and long-term market expectations for inflation. Five-year inflation expectations did reach a post-GFC high of 2.7% earlier this year, but have since ticked back down below 2.5%. While this is above the Fed’s long-term target of 2%, it is a far cry from “unseated expectations.” If we step back and take a broader view of where the U.S. economy is relative to its potential output level, there is still a massive gap — especially if we consider the potential of workers who left the workforce in 2020 returning to employment as the pandemic continues to ease.
Ashley: What does all this mean for long-run investors? In terms of downside risk, if asset prices do decline substantially because the Fed takes away the punch bowl sooner than expected, what does this mean for the economy and long-term investment returns?
Christian: Let’s imagine the best scenario. Even if market prices are right (and I’m wrong about bubbles), market participants are presuming a lot. Indeed, suppose that the elevated prices we observe across financial markets are justified by subsequent cash flows. At an aggregate level, this would necessarily mean very impressive economic growth. However, that expectation is already baked in – the real economy would simply catch up to current valuations, confirming the impressive expectations those valuations already reflect. Valuation ratios, like the CAPE, would normalize because the denominator (earnings) would increase. This is the upside scenario – impressive economic growth, but little room for valuation multiples to expand further and future realized returns would be muted. The downside scenario is, of course, dire. Suppose realized future cash flows fail to live up to these lofty expectations. Valuation ratios would normalize by a fall in the numerator (prices), meaning markets sell off as participants downwardly revise their expectations going forward. Taken together, I see nothing but negative asymmetry — little additional upside potential and significant downside risk. At best, long-run expected returns critical for institutional and 401k investors are quite low.
Greg: Once again, I’m not sure this is the lesson history provides. Let’s go back to the dotcom bubble – if we look at stock prices as measured by CAPE, this was an even bigger over-valuation than what we might be experiencing now. Nonetheless, the average annual return for the S&P 500 from the peak of the bubble (March 2000) to today is 7.2%. Admittedly, this is quite a bit lower than typical long-run average returns, but it is much higher than cash or bonds over the same time frame. While markets can, and do, decline substantially for years at a time, investors with a 20-year horizon are likely still better off with a good portion of their assets in stocks. Of more concern to me would be short-run damage to financially fragile households who have already been hit hard by the pandemic. A large decline in asset prices, and the ensuing negative “wealth effect” on the economy, could result in more unemployment, loss of household savings, personal bankruptcy and even foreclosure on households that end up underwater. As we saw after the GFC, these can have lasting effects on lower-income households; my hope is that we don’t see such history repeat.
(C) UNC-CH Kenan Institute of Private Enterprise


